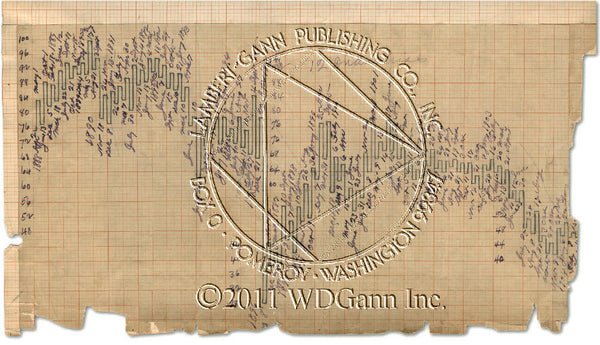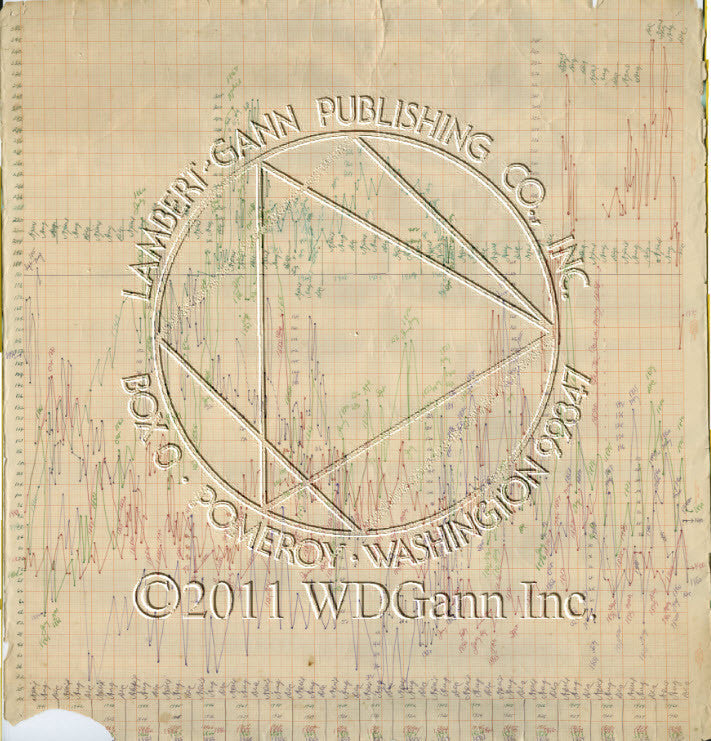
20-Year Wheat Master Forecasting Chart
$ 800.00
This is one of W.D. Gann's master charts for wheat containing data for over 100 years!
W.D. used the 20 year cycle to quickly and easily find data and repeating cycles throughout this time period.
Gann made master charts for many commodities, stocks, and natural phenomenon. This one is updated nearly to his death, so it is of great importance to wheat trading.
*
The chart measures approximately 32 x 34 inches and will make a beautiful addition to your office, home, or barn.
There is one small piece missing in the bottom left hand corner of the chart. The dates involved are easily worked out.
Do you keep master charts for the markets you trade? Do you think it may be important?
"In order to make up an annual forecast, you must refer to my Master 20-year Forecasting Chart and see how these cycles have worked out in the past. As stated before, the 20-year cycle is the most important cycle for forecasting future market movements. It is one-third of the 60-year cycle and when three 20-year cycles run out, important bull and bear campaigns terminate.
By placing the monthly high and low prices for each of those 20-year periods above each other, it is easy to see how the cycles repeat.
No person can study the Master 20-year Forecasting Chart and the cycles without being convinced that the time cycles do repeat at regular intervals and that it is possible to forecast future market movements. By studying Resistance Levels, Geometric Angles, and Volume of Sales in connection with the cycles, you can determine when the trend is changing at the end of campaigns." --W. D. Gann
Customer Reviews
No reviews yet
Write a review