Digital Yellow truck chart package
This Chart Set will be delivered to your email instantly upon ordering. These are big files that you can study on your computer, or print them locally to save on shipping costs.
Enhance the walls of your office with Yellow Truck Mfg.
An original WD Gann print.
This 4-piece set is not only conversational, it’s educational.
The unique Resistance Card was found attached to the original charts with a paper clip. With close inspection you can readily learn several trading methods.
These charts contain over twenty volatile years of data-1921-1943.
All charts are beautifully reproduced full color on high quality paper.
This is quite possibly "Major Motors" from The Tunnel Thru The Air.
Features
These Yellow Truck charts and their included resistance card indicate many technical analysis points that W.D. Gann writes about extensively in all his courses and books. This makes it a valuable study package.
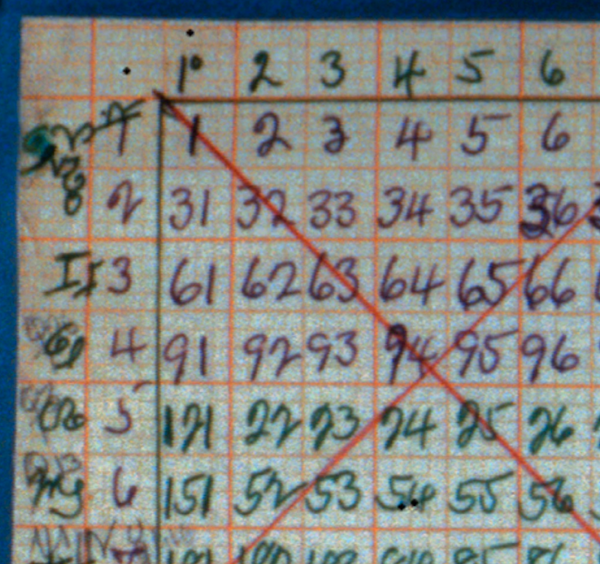
The Resistance Card
The pre-printed form includes spaces to record incorporation date, monthly, weekly, and daily time counts, highs and lows, and turning points.
It clearly shows how W.D. Gann has applied the breakdown of the yearly ranges into fractions and applied them to the appropriate degree of the circle. This reinforces all of his work on seasonal time and the zodiac.
Gann also boldly outlined the midpoint or 180 degree point, amplifying the importance of the 50% rule on the pre-printed card. The card also allows easy comparison of previous price ranges, to see support and resistance.
These resistance cards were built by W.D Gann and they still hold up as a simple, informative, visual trading tool.
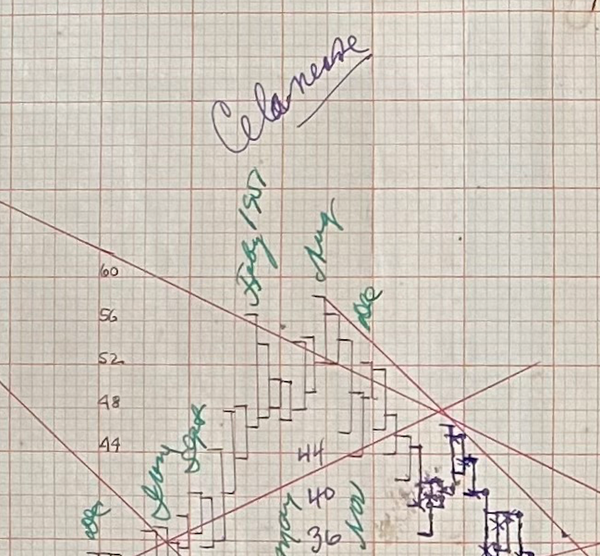
The Yearly Chart
This chart shows data for the years 1921 to 1943. W.D Gann was using a 16 point to inch scale where every 1/8 equals 2 points. This method clearly shows the yearly highs and lows to establish future trading ranges.
Another point worth noting is that W.D. Gann wrote Truth of The Stock Tape in 1923.
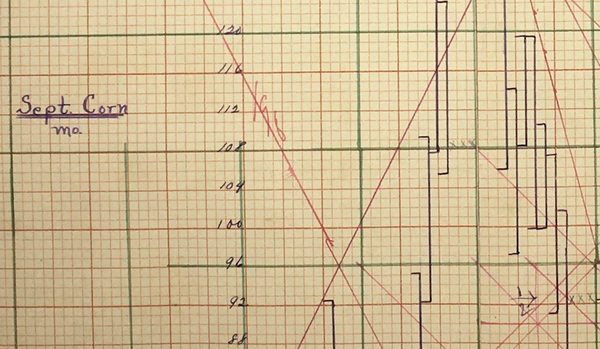
The Monthly Chart
This chart shows data from November 1923 thru to October 1943, which is when Yellow Truck was taken over by General Motors. General Motors was a Major shareholder in Yellow Truck.
The structure of the monthly chart is very interesting, as the price scale is 8 points to the inch. You will be able to calculate the exact pitch of the angles as applied by W.D. Gann.
You will also be able to see importance of the monthly time count and how it is being applied. The position of the time count lines coincide with the ranges of the resistance card.
W.D. Gann has also drawn the Square of 144 overlay onto the chart.
A high level of detail is present that coincides with Major Motors in The Tunnel Thru the Air. These charts are a nice visual companion to both Wall Street Stock Selector 1930 and New Stock Trend Detector 1936.
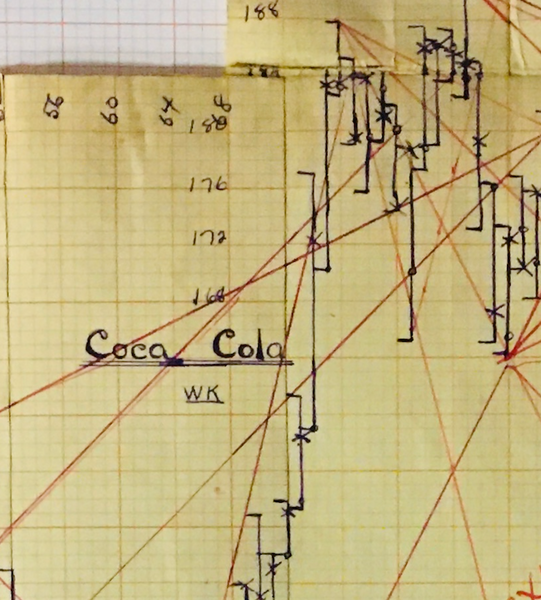
The Weekly Chart
This chart shows data from January 2, 1937 to October 2, 1943. Again, the scale is different as the price scale is 4 points to the inch. The weekly chart goes into much more detail. W.D. Gann recorded the volume of stocks traded, which reinforce W.D. Gann’s teachings on volume. You will be able to see the market price action at higher and lower volume.
This is an ideal package to aid in your study of Gann’s methods.