12 Industrials (limited edition)
$ 500.00
W.D. Gann's "12 Industrials" Chart
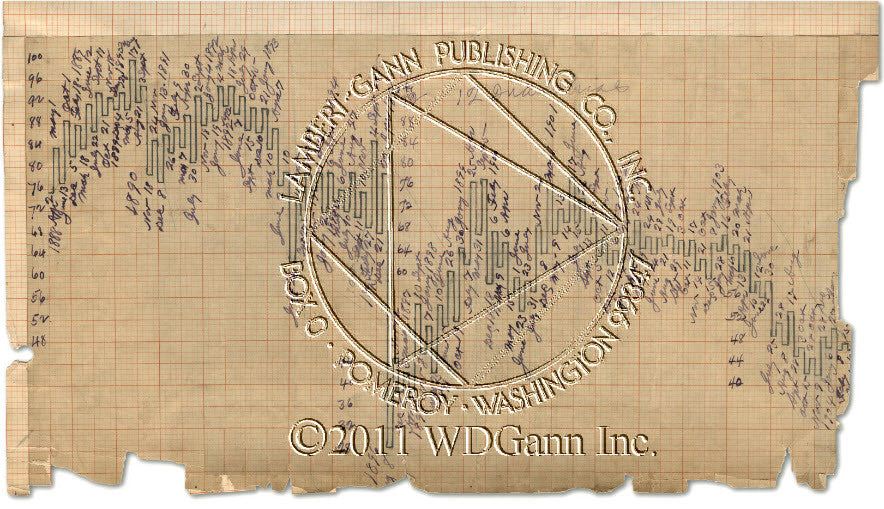
This is the birth of the Dow Jones Industrial Average, and also one of the oldest charts in our collection. It's dimensions are 11 by 20 inches.
This chart was obviously used often, judging by the amount of dark discoloration on the chart, and the fact that it was later glued to another piece of newer, lighter chart paper.
We have decided to share this chart with you, since many of the charts of this age will never be allowed out of our vault again due to the apparent frailty and age of the original. The original will be stored away for good.
The DJIA historically began on May 26, 1896. Data begins in April of 1888 on this particular chart. The earlier data consists of the precursor to the DJIA-The Dow Jones Averages.
The original 12 stocks making up the Dow Jones Industrial Average were:
American Cotton Oil
American Sugar
American Tobacco
Chicago Gas
Distilling & Cattle Feeding
General Electric
Laclede Gas
National Lead
North American
Tennessee Coal & Iron
U.S. Leather Pfd.
U.S. Rubber
Many of these are still active but have different names.
The swing chart contains the lowest close of 28.48 on August 8th, 1896 and concludes in 1904. The birth dates and all-time low are very important factors when using Gann's methods.
At the time of this charts release, August of 2011, the DJIA has been very active with wide fluctuations and a 10 percent drop in the last month. For over 115 years this has been a closely watched index.
You can see some of the earliest Gann angles drawn lightly upon the chart. This may have been W.D. Gann's first studies on what are now termed "Gann Angles".
This chart was first given to students attending our workshop in August of 2011.
Only 72 prints of this chart will ever be made and the original will not be shown again.
We are pleased to share this chart with you and know you will see the beauty, information, and history contained in this century old print.


