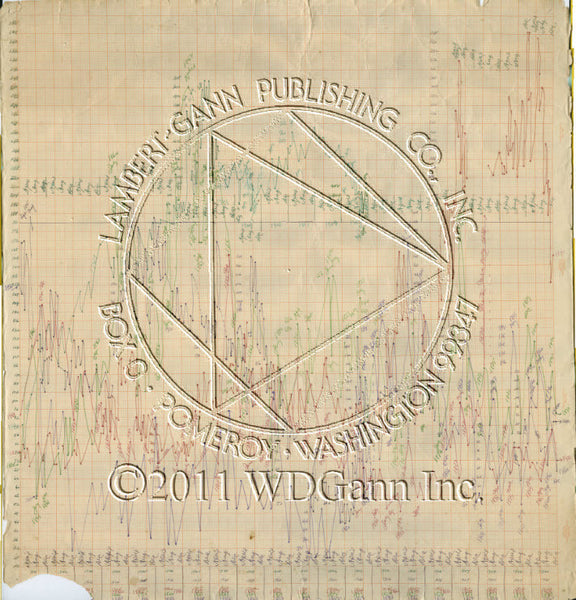
Dow Jones Averages 20 Year Cycle Chart
This is W.D.Gann's Dow Jones Averages master cycle chart. We are releasing it to commemorate 90 years since the great run in 1929, which is shown here in green.
It contains 5 sets of charted monthly data in 7 year groups beginning on "9" years. Each twenty years from 1869, a new differently colored data set is plotted to give Gann a visual view of the past cycles and possible path of future cycles.
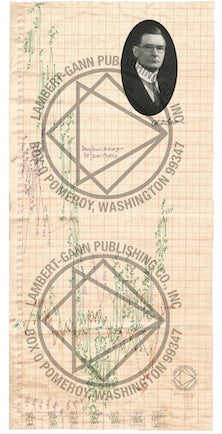
This chart print has been carefully scanned and is shown to you in its original state, without any digital cleanup. Only a small watermark will be present in the lower right corner. It measures 33 inches tall and 15 inches wide.
The two large watermarks will not be on your chart-they are only to protect the digital image.
To make this a special chart suitable for framing in your office, we have printed a photo and signature of W.D.Gann on the chart.
As a bonus, 2 full sheets of our large blank chart paper will be included with this chart to give those of you industrious enough room to "fill in" the last sets of data --giving you a useful map of the past, and a possible window to the future.